
About Me
I am a final year PhD student at Stanford University and the SLAC National Accelerator Laboratory, advised by Professor Mike Dunne. My research focuses on developing AI-based methods to analyze X-ray and neutron scattering experiments in real-time and designing methodology to enable targeted, intelligent data acquisition strategies.
Prior to Stanford, I obtained an MPhil degree in Scientific Computing from Cambridge University under the supervision of Professor David Wales and a BA in Chemistry from Pomona College under the supervision of Professor Fred Grieman.
PhD Projects
Targeted materials discovery using Bayesian algorithm execution
Very brief summary: this paper proposes several techniques to intelligently locate subsets of a material design space that are aligned with complex, user-defined goals. More details to come! For now, please check out our arxiv pre-print and code for further details!
Capturing dynamical correlations using implicit neural representations
 Graphic created by Gregory Stewart!
More details to come! For now, please check out our publication, code and press article for further details!
Accurate Photonizing and Contrast Estimation for X-ray Photon Correlation Spectroscopy
Many important physical processes occur on very (very) short timescales (i.e. on the order of femtoseconds). At the Linac Coherent Light Source (LCLS), we study these phenomena using incredibly bright, pulsed X-rays; one technique is known as X-ray Photon Correlation Spectroscopy. At a high-level, the idea is to use extremely coherent light to collect scattering from individual atom positions as images known as speckles (an example image is shown above, courtesy of Josh Turner).
To study dynamics, two sequential X-ray pulses are shot (with variable time-delay) at a sample to obtain two snapshots (X-ray speckle images) of the sample structure at different times. If the speckle images are the same at both time points, this implies that the structure has not changed between the two pulses. Conversely, if the X-ray images are very different, it implies that something has changed in the sample over that corresponding time-scale. By systematically changing the time-delay we are able to map out very complex processes in materials and create “molecular movies”.
The figure-of-merit for quantifying how two X-ray images are different is known as the contrast. The ultimate goal of our work is, therefore, to accurately estimate the contrast from X-ray detector images. In order to determine the contrast, it is first neccesary to count the number of photons hitting the detector at each pixel. Our input to the model is the raw detector image (which may have significant noise, charge-sharing etc) and our output is a sparse-matrix corresponding to the photon counts at each pixel (photonizing). In the image above, we show that we can accurately photonize the input using a CNN.
Please check out our publication, code and press article for further details..
Automatic prediction of crystal lattice parameters from powder X-ray Diffraction data
Powder diffraction is a widely used X-ray based method used to study the structure of crystalline materials. These techniques are particularly insightful in allowing us to understand why particular materials have certain physical properties (such as strength, conductivity, stiffness etc). Using this knowledge, we are better able to intelligently design new materials with desired attributes. Currently, the analysis of powder diffraction data can take significant time and human effort, and therefore any efforts to automate this process will be very useful.
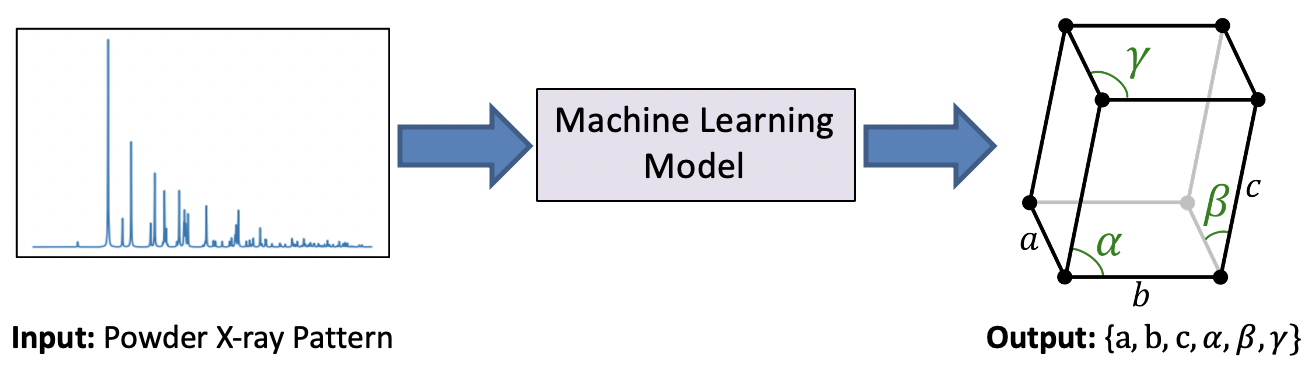
In this project, we develop supervised learning models to predict the shape of the unit-cell of a crystal from simulated data as well as experimental data collected at the Stanford Synchrotron Radiation Lightsource (SSRL). As shown in the image above, the unit-cell shape is fully defined by six numbers, three lengths and three angles, and therefore this problem can be formulated as a standard non-linear regression task with six outputs. Please check out our publication for more information.