
Visualizing and Interpreting Neural Network Loss Landscapes under Mislabelling and Reduced-Connectivity (2019)
Neural network loss landscapes are incredibly complex functions of trainable parameters. Gaining a better understanding of the structure of these landscapes might help us develop better optimizers and loss functions, thereby improving the predictive capacity of neural networks. Unfortunately, due to computational limitations, there has been relatively little work exploring the full structure of these non-convex functions.
Our approach involved creating topological maps (disconnectivity graphs) of the surface, like those shown below. In these images, the vertical axis represents the neural network training loss. The branches of the graph correspond to the minima of the loss function. More specifically, each branch represents the vector of parameters containing the weights for the neural network, and terminates at a height on the vertical axis corresponding to the training loss function. The branches join together at regularly spaced intervals on the vertical axis when they can interconvert via pathways mediated by index one saddle points. The inspiration for such a decomposition comes from free energy lanscape physics, where minima correspond to stable molecular structures and index 1 saddle points correspond to transition states.
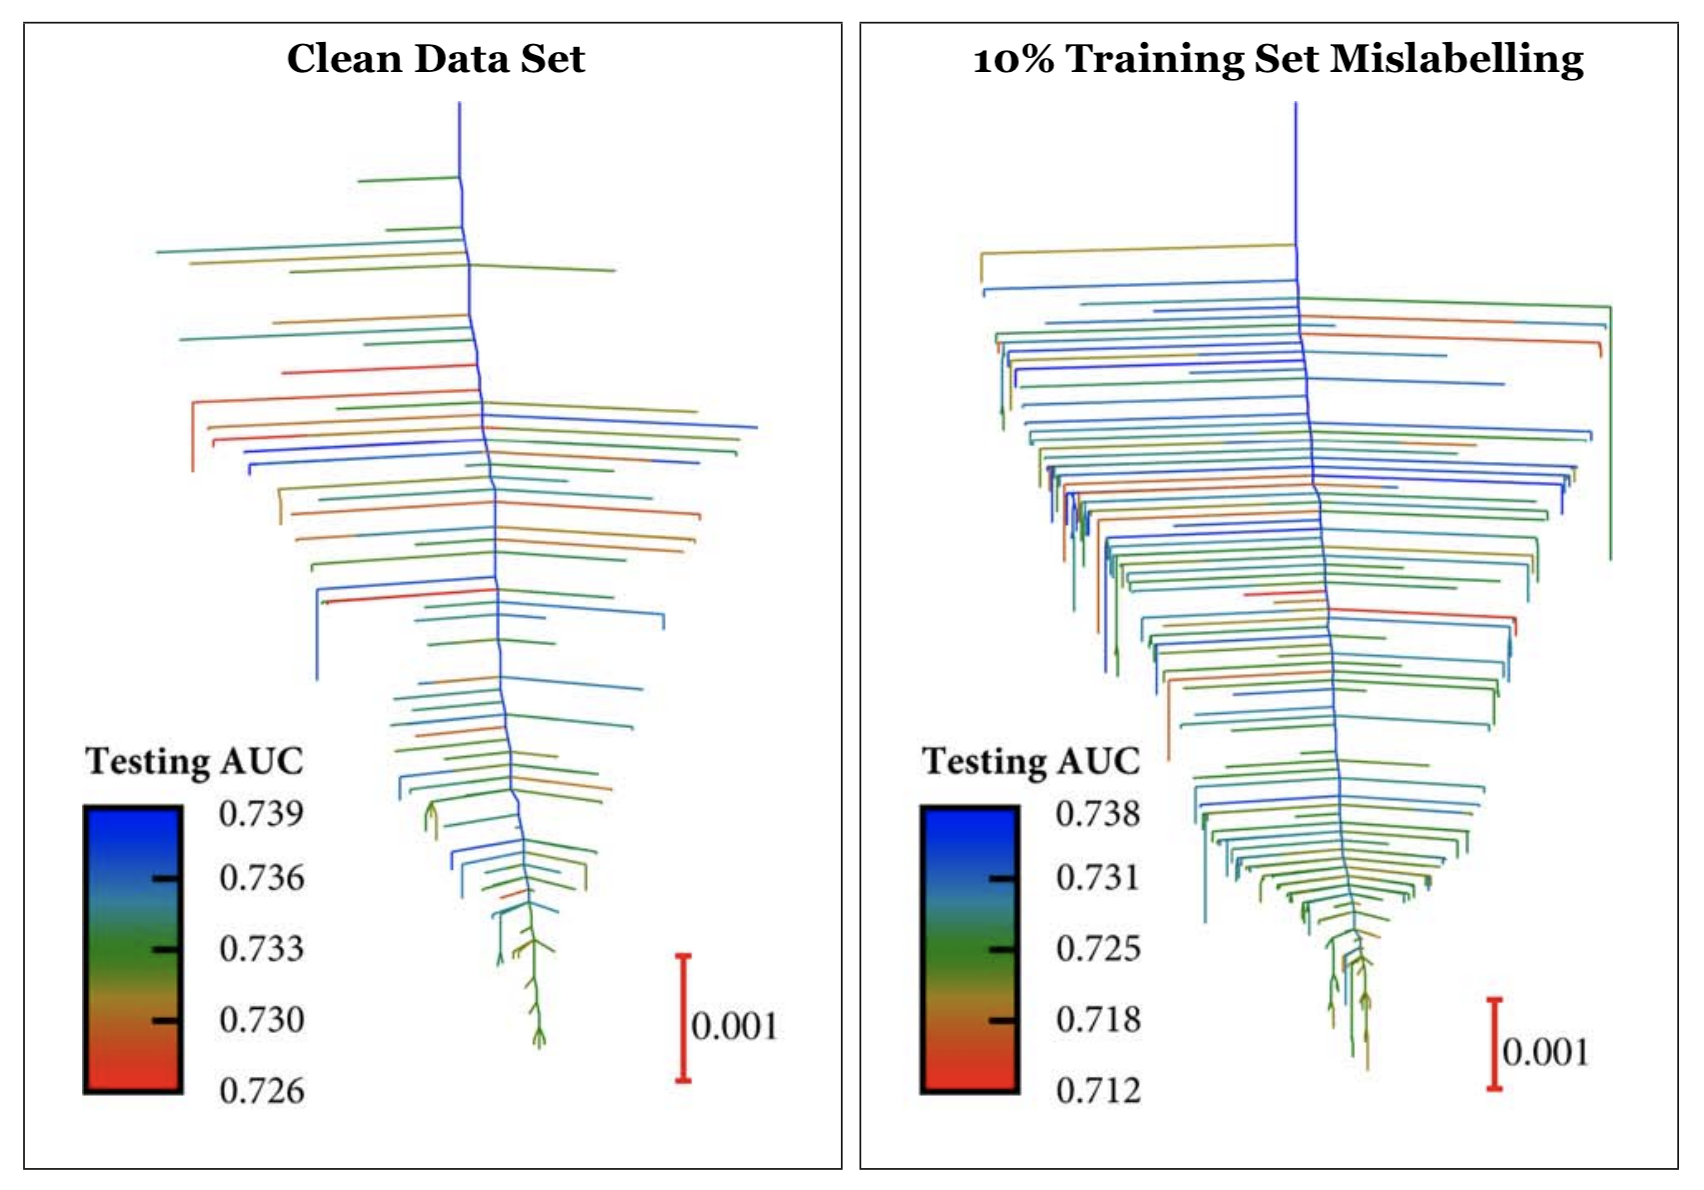
In particular, our work focused on using disconnectivity graphs to study how the loss function for single-layered neural networks changes as deliberate errors (mislabelling) is introduced into the training dataset as well as how they change when connections between neurons are systematically broken. Our main findings show that the number of minima grow as the mislabelling fraction increases. For example, the image on the right corresponds to mislabelling ten percent of the dataset; the image on the left corresponds to control “clean” dataset. Here we color each minima by its performance on the test set as measured by AUC. Interestingly, the lowest training loss minimum does not neccesarily correspond to the best test performance.
To learn more about our work in this area, please check out the paper links!
Paper: “Perspective: new insights from loss function landscapes of neural networks” [LINK]
Thesis: “Machine Learning Landscapes for Neural Networks with a Single Hidden Layer.” [PDF]
Collaborators: Philipp Veepoort and Alpha Lee
Supervisor: Professor David Wales
Methane Oxidation on Mars (2017)
Based on current models (atmospheric flow and meteroite impacts), there should be a relatively substantial amount of methane on Mars. Therefore, it was very suprising when the Curiosity Mars Rover detected almost none. Our project investigated the reason for this discrepency. Our hypothesis was that UV light from the sun activates a molecule known Magensium Perchlorate in the Martian soil and causes it to oxidize methane into other carbon derivatives. To simulate this environment, we performed infrared spectroscopy measurements on a cell containing Magnesium Perchlorate and UV light.
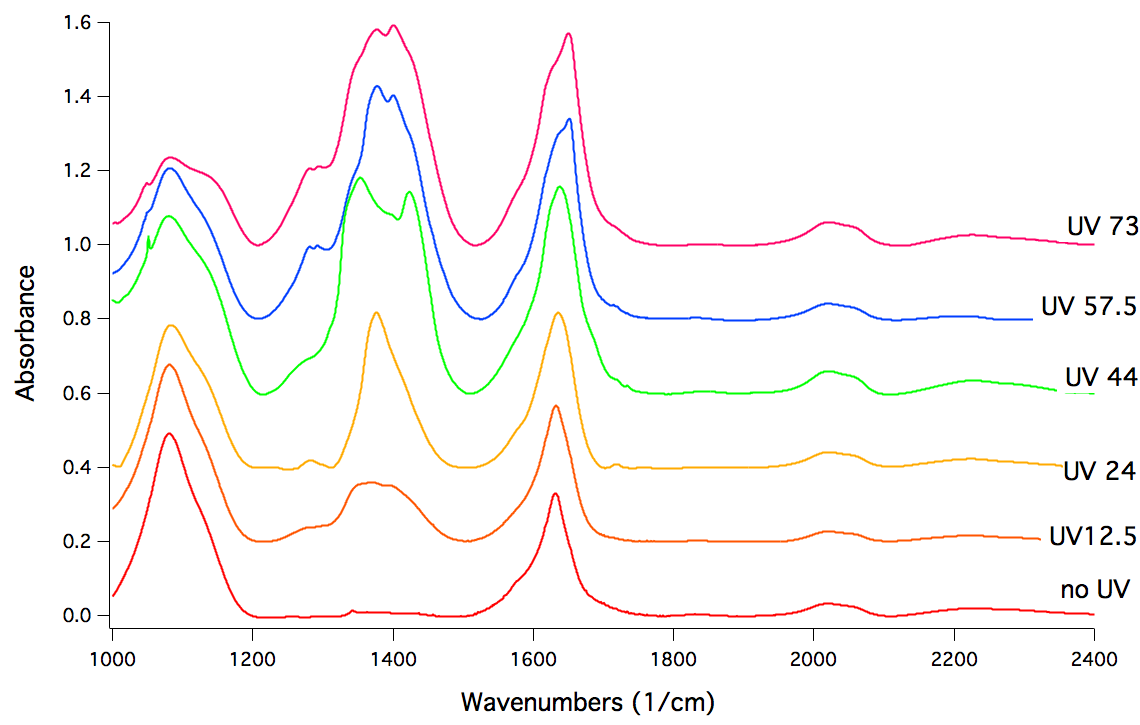
Shown above is the effect of irradiating Magnesium Perchlorate with UV light over time. Here each plot is a snapshot of the same system after being exposed to a certain duration of UV irradiation (in hours). In particular, note the large peak that grows between 1200 and 1500 wavenumbers. This peak corresponds to the formation of various (previously uncharacterized) chlorine oxide derivatives. Thus, our experiment shows that UV light can activate the surface of Magnesium Perchlorate. Future work will likely include studying how this activated surface interacts with methane.
Please check out our paper for further information!
Paper: Reaction of methane and UV-activated perchlorate: Relevance to heterogeneous loss of methane in the atmosphere of Mars. [LINK]
Supervisors: Xu Zhang and Professor Fred Grieman
Studying Heart Ultrasounds via Unsupervised Learning (2016)
The most important feature in predicting heart disease from cardiac ultrasound videos is the ejection fraction (EF), a metric that quantifies the amount of blood that is pumped by the heart during one cardiac cycle. A good estimate of this quantity is the difference in volume between the left-ventricle of the heart when it is fully expanded (end-diastole) and when it is fully contracted (end-systole). Our work, therefore, focused on automatically selecting frames corresponding to end-systole and end-diastole from 30 second ultrasound videos.
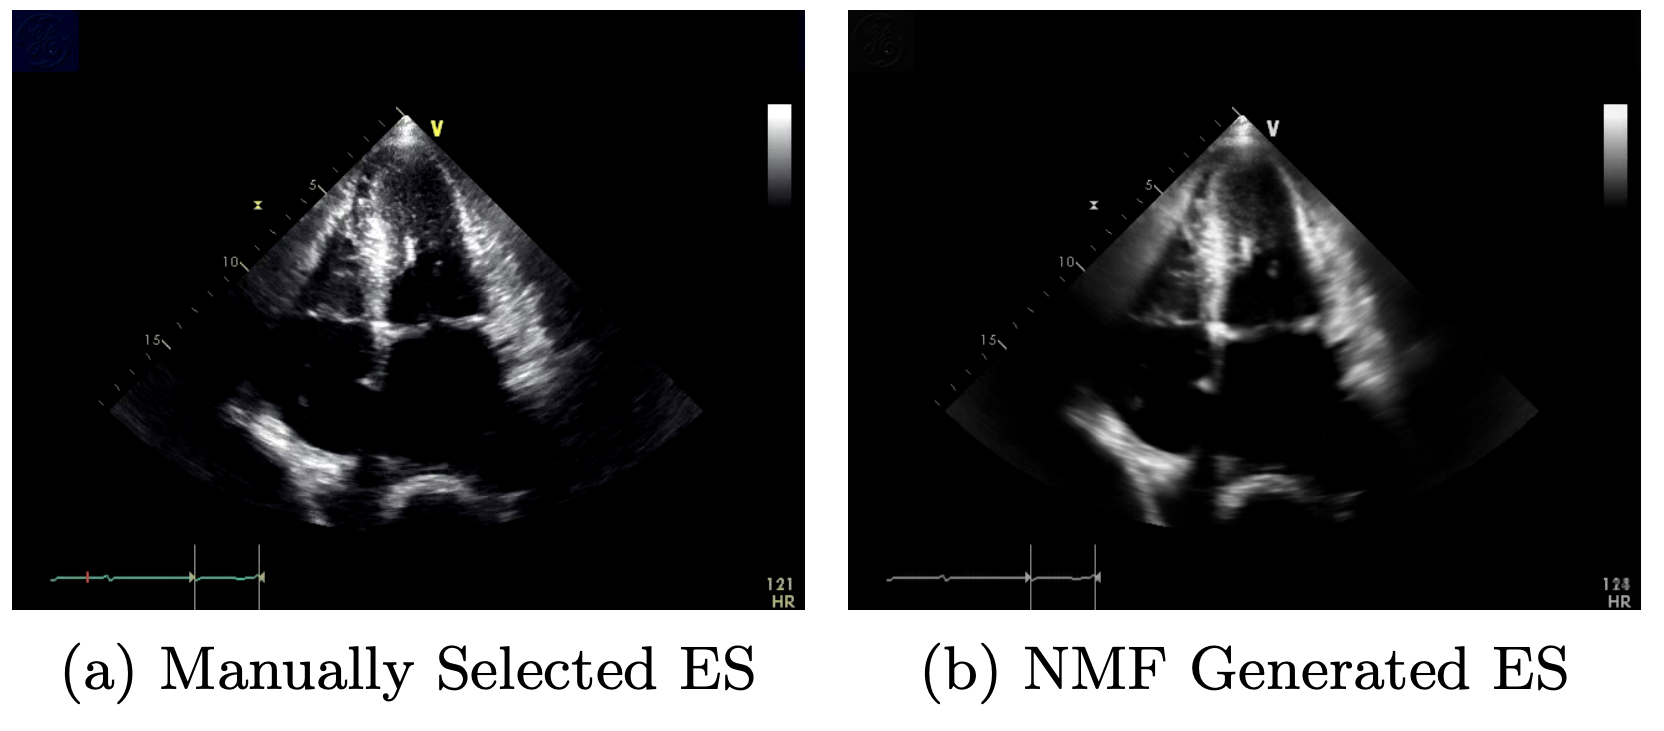
To approach this problem, we unpacked the video into a large matrix with dimensions (number of frames, number of pixels) and applied Rank-2 non-negative matrix factorization (Rank-2 NMF). This method is similar to eigendecomposition with the addition that the weight-matrix is constrained to have positive entries. We found that Rank-2 NMF, applied to cardiac-ultrasounds, generates end-members (similar to eigenimages) that very closely resemble end-systole and end-diastole. The image above, for example, shows a comparison between the real end-systole (ES) frame and the NMF generated frame. We then applied a patch-matching algorithm to segment the correct end-systole and end-diastole frames in order to accurately estimate the ejection fraction in an unsupervised fasion.
Please check out our paper for further information!
Paper: “Machine learning for cardiac ultrasound time series data.” [PDF]
Collaborators: Geoffrey Iyer, Nuoyu Li, Xiaochuan Xu, Ruohan Zhan, Rafael Llerena, Jesse Yen
Supervisors: Baichuan Yuan and Professor Andrea Bertozzi